California encourages developers to pursue urban infill projects in order to achieve a variety of infrastructure efficiency and environmental goals. Since they are already surrounded by established developments, infill projects provide better opportunities for walking, bicycling, and public transit, and they encourage fewer automobile trips than new suburban developments. Nevertheless, developers often meet resistance when proposing infill projects. Neighbors worry, “The development will increase traffic and make it difficult to park.” Public officials warn, “The developer must pay a fair share of the roadway improvements that are needed to serve the additional cars and trucks.”
To address these concerns, developers must complete a transportation impact assessment (TIA), required by federal, state, and local laws. If an assessment predicts that an infill project will generate more automobile trips than local streets can handle, local officials may require the developer to build or pay for wider roads, additional turning lanes, or larger parking lots. By accommodating more cars and trucks, these requirements counteract potential reductions in auto travel. In addition, the added costs make some infill projects financially infeasible, causing developers to scrap infill proposals in favor of suburban greenfield development.
Why isn’t this process working? The answer is related to the traditional TIA approach. The California Department of Transportation (Caltrans) asked our UC Davis research team to delve into TIA trip generation practices, and in response we created an adjustment tool that improves the accuracy of estimating automobile trips in urban areas and should make it easier for developers to get infill projects approved.
The Heart of the Problem
At the heart of the TIA process is the Institute of Transportation Engineers (ITE) Trip Generation Manual, used throughout the US for decades. This manual provides automobile trip generation rates—the number of cars and trucks expected to enter and exit a site per hour—for land uses ranging from apartments and offices to coffee shops and bowling alleys. As the industry standard for many years, ITE trip generation rates have rarely been challenged. Local governments use them to evaluate developments in vastly different geographic areas, from the suburban fringe to the city center. The rates are typically derived using the simple relationship between the size of a development and the predicted number of trips generated by that development during a particular time of day (e.g., the number of trips per 1,000 gross square feet of retail, during the afternoon peak hour).
ITE estimates trip generation rates using data collected by practitioners and researchers at development sites throughout the United States. To control for external influences on automobile trip generation rates, ITE requires data be collected at isolated, single-use sites that are neither served by transit nor typically accessed on foot or by bicycle. In other words, most urban infill sites, transit-oriented developments (TODs), mixed-use sites, and other types of “smart growth” developments are not incorporated into ITE calculations; the sites represented in the manual are primarily suburban. Since smart growth developments increase travel by modes other than automobiles, the ITE rates likely over-estimate vehicle trips for these projects.
Since smart growth developments increase travel by modes other than automobiles, the ITE rates likely over-estimate vehicle trips for these projects.
Recognizing this possibility, the ITE Trip Generation Handbook provides clear guidance that the ITE trip generation rates do not apply in smart growth areas. But this leaves several critical gaps for practice. How inaccurate are ITE-based trip generation estimates in smart growth areas? If ITE rates aren’t appropriate, what trip generation rates should be used for smart growth developments?
How Big is the Problem?
 Recent studies suggest that ITE rates overestimate automobile trips in smart growth areas. For example, one study found that at a sample of 17 residential TODs, trip estimates based on ITE rates were, on average, 80 percent higher than the number of documented vehicle trips. Another study of mixed-use urban infill sites found that ITE-based estimates were up to double the number of actual vehicle trips. Our own analysis of 22 smart growth sites in California found that ITE-based estimates of evening peak-hour vehicle trips were on average 50 percent higher than observed rates at mixed-use developments, and 90 percent higher than at infill sites. Though these studies are based on data from a limited number of sites, they provide convincing evidence of overestimation.
So what is the alternative? A few innovative communities have developed their own local trip generation rates, while others have worked with consultants to adjust ITE rates. These adjustments account for characteristics such as population and employment density, transit service, and pedestrian and bicycle facilities. We reviewed these methods and found that, while substantially better than the ITE rates, they still had flaws: data collection and analysis remained burdensome, few methods could be transferred to other communities, and some methods were insensitive to smart growth variables. Also, some of the methods were based on data from travel diary surveys rather than observed trip-generation data. Because of these limitations, we collaborated with Caltrans and our project review panel to develop a new, easy-to-use method to adjust trip generation for smart growth sites.
New Data Reveal More Insights
We developed a rigorous data collection method to count vehicle trips as accurately as possible at sites in smart growth areas. Many characteristics of smart growth sites present challenges for data collection, including mixed-use buildings (e.g., a coffee shop on the first floor of an office building), on-street parking, parking lots shared by multiple land uses, and internal doorways connecting to parking garages. To address these challenges, we combined door counts and intercept surveys at 30 targeted land uses in central areas of Los Angeles, Oakland, Sacramento, and San Francisco. The results showed more evidence of the discrepancies mentioned earlier: ITE rates overestimated vehicle trips by an average of 2.3 times in the morning peak-hour period and by 2.4 times in the evening peak-hour period.
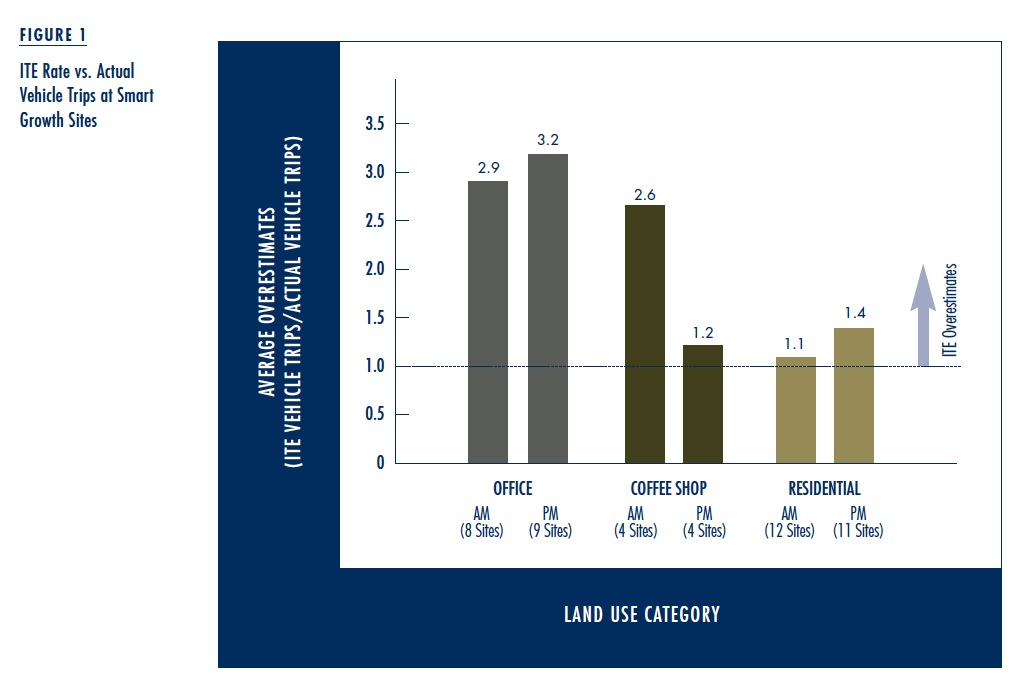
If the ITE rates overestimated vehicle trip generation by these ratios at all smart growth sites, it would be simple to adjust a rate by dividing it by 2.3 or 2.4 to get the correct vehicle trip estimate. However, the accuracy of the ITE rates varied substantially among the study sites (Figure 1). For example, on average, ITE rates overestimated vehicle trip generation at office buildings by 2.9 times in the morning and 3.2 times in the evening peak hour. They overestimated trip generation at mid- and high-density residential buildings by 1.1 times in the morning and 1.4 times in the evening peak hours. We suspected that, in addition to land use, the site itself and surrounding built environment characteristics also affected the magnitude of ITE overestimates. Therefore, to adjust ITE estimates correctly, our smart growth adjustment method must account for a variety of influences on travel behavior that may be operating at a given site.
A New Smart Growth Adjustment Method
We chose a statistical modeling approach to account for a variety of influences on vehicle trip generation, such as the characteristics of the site, adjacent streets, and surrounding neighborhood. To maximize the data available for the new method, we supplemented our initial 30 study sites with trip-generation data collected by other researchers and consultants from more than 30 additional California smart growth sites.
We followed a two-step process to adjust ITE estimates for smart growth developments:
Step 1: Calculate a smart growth factor (SGF) to quantify how well the site represents smart growth characteristics. The SGF expresses the cumulative impact of variables such as distance from the site to the central business district, population density, job density, metered on-street parking, transit service near the site, building setback from the sidewalk and surface parking coverage at the site. All of the SGF components can be easily measured from available data sources.
Step 2: Apply a morning or evening peak-period equation to calculate ITE adjustments. Both the morning and evening equations include the SGF from Step 1, indicator variables for office and coffee shop land uses, and an indicator variable for sites located within one mile of a university campus.
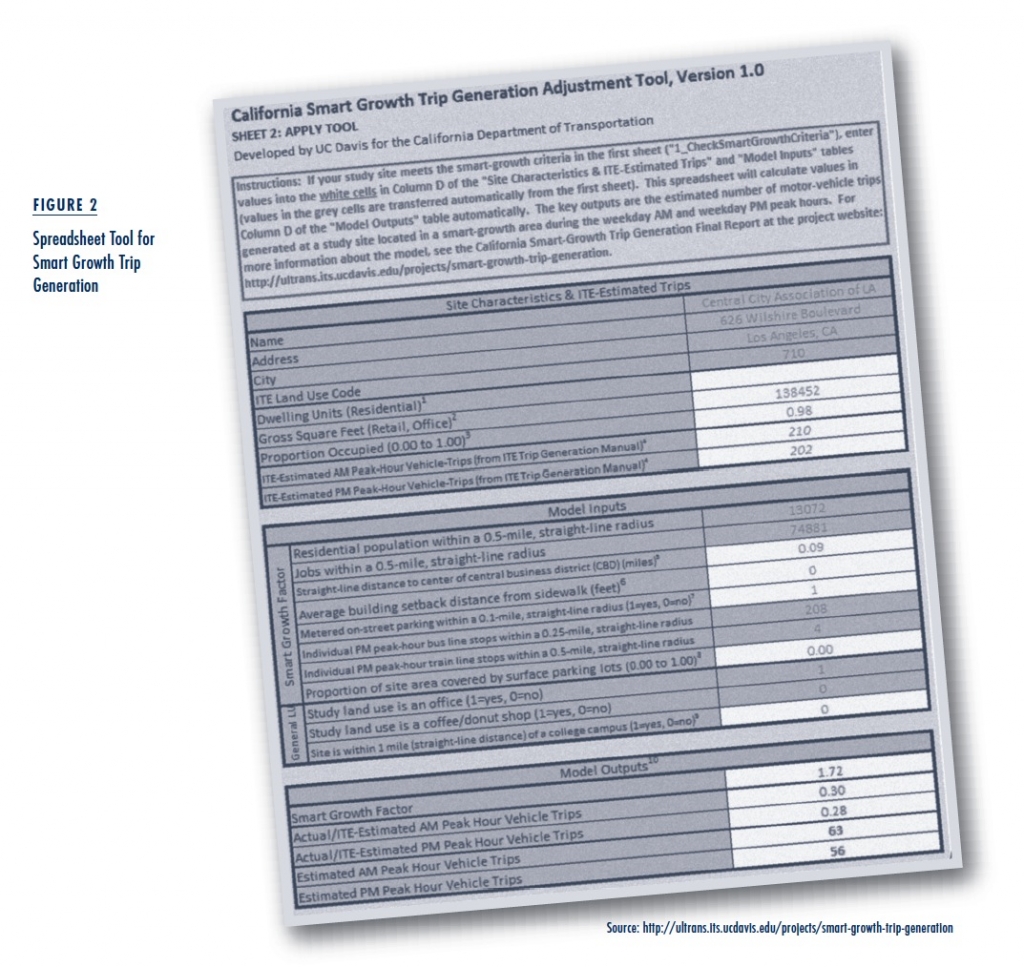
The equations adjust the number of trips estimated by ITE rates to provide a more accurate estimate of vehicle trip generation at a smart growth site. We built these equations into a free, user-friendly spreadsheet that can be downloaded and applied by practitioners during the TIA process (Figure 2).
The Future of Trip Generation
This research provides practitioners with the tools to improve TIA practice in California. Planners and developers now have an easy-to-use tool at their disposal to adjust ITE estimates. This more realistic assessment of automobile trip generation should make it easier for developers to get urban infill sites approved. Still, we can improve accuracy by expanding the sample of sites and by examining additional land uses listed in the ITE Trip Generation Manual. Furthermore, since the SGF simply adjusts the ITE method, it does not address the method’s existing limitations, such as basing trip generation rates for some land uses on small samples and distinguishing between average and marginal trip generation (see Millard-Ball’s article in this issue).
This initial smart growth trip-generation adjustment tool is part of a broad movement to improve trip generation practice. The ITE Trip Generation Handbook is currently being updated, opening up possibilities to improve the most widely accepted approach for TIAs. For example, researchers are expanding trip generation estimation tools to include walking, bicycling, and public transit. Our data collection method helps quantify trips made by these other modes, providing the foundation for a future multimodal trip generation database.
It is particularly important for planners and developers to be able to estimate multi-modal trip generation in smart growth areas, since it can guide them to better allocate available right-of-way among different modes based on anticipated demand. Trip generation models can also influence the resources allocated to projects that upgrade sidewalks, bicycle lanes, safe roadway crossings, and public transit service.
By supporting urban infill development, this new tool can make our cities more sustainable and better places to live.
This new smart growth trip generation tool is a significant step forward. In response to proposed development, neighbors may now say, “This project will create more life on our streets without having a big impact on traffic.” Public officials can proclaim, “The development is bringing more jobs and residents to the core of our city while improving the sidewalks, bicycle lanes, and transit systems that serve them.” By supporting urban infill development, this new tool can make our cities more sustainable and better places to live.
This article is adapted from “Method to Adjust Institute of Transportation Engineers Vehicle Trip-Generation Estimates in Smart-Growth Areas,” originally published in Journal of Transport and Land Use.
Further Readings
Robert Schneider, Kevan Shafizadeh, and Susan Handy. “Method to Adjust Institute of Transportation Engineers Vehicle Trip-Generation Estimates in Smart-Growth Areas,” Journal of Transport and Land Use, Forthcoming.
Robert Schneider, Kevan Shafizadeh, Benjamin R. Sperry, and Susan Handy. “Methodology to Gather Multimodal Trip Generation Data in Smart-Growth Areas,” Transportation Research Record, Forthcoming.

