[sharelines]If you found out you were emitting a lot of #C02, would you change your travel behavior?
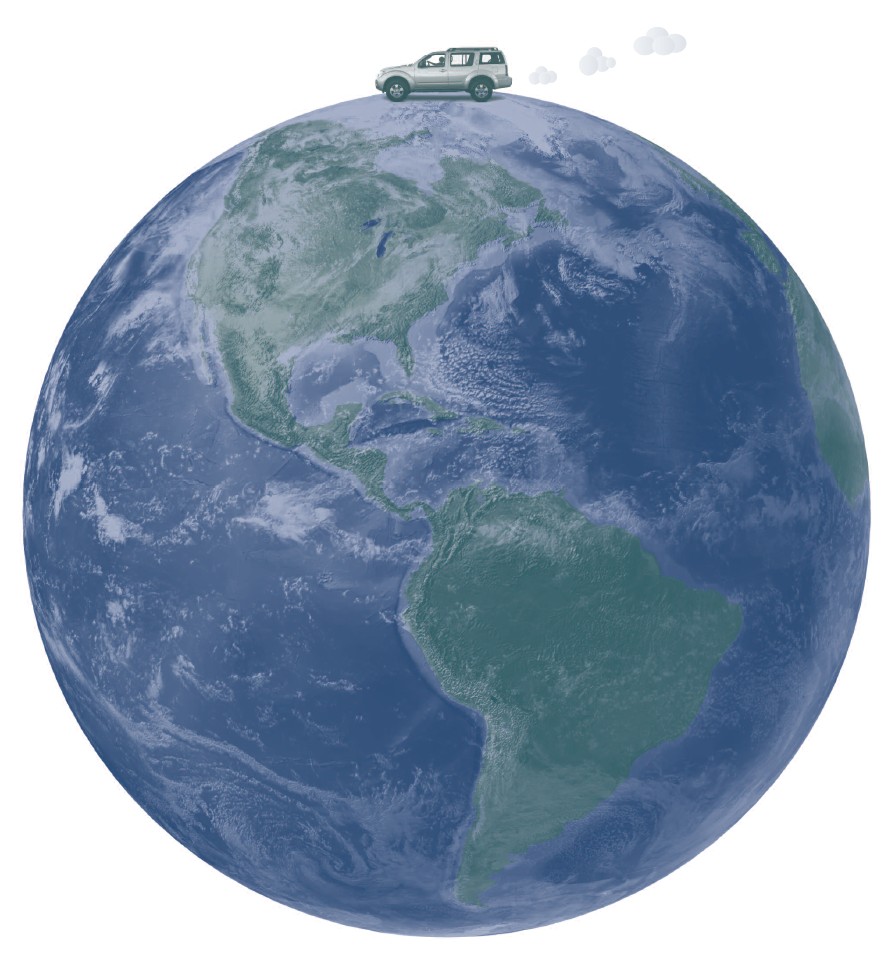
Halting climate change will require a concerted effort to reduce emissions from on-road vehicles. While significant progress has been made to improve vehicle efficiency and reduce CO2 emissions, surface transportation accounted for half the increase in US greenhouse gas (GHG) emissions over the past two decades. Today, surface transportation accounts for 24 percent of all US emissions.
Automobile improvements alone will not be sufficient to meet federal and state emissions targets; policy makers also need to identify solutions that reduce the demand for car travel. Information technology offers a promising breakthrough on this front.
While many people are aware of the environmental damage caused by GHGs, that knowledge has not resulted in substantially less car travel. If travelers knew more about the impacts of their travel decisions, they might change their trip modes, routes, or departure times. And if they could compare their trips to those of their peers or the national standard, they might change their travel habits even more. To test this idea, we built and evaluated an information technology called Quantified Traveler. QT is meant to encourage travelers to be more mindful of their travel decisions and encourage drivers to walk, bike, ride transit, or forego a trip altogether.
If travelers knew more about the impacts of their travel decisions, they might change their trip modes, routes, or departure times.
To test the effects of QT, we recruited 135 subjects from UC Berkeley to track their travel habits using our phone app. QT then processed the data into travel diaries (lists of trips with times, locations, routes, and modes) while producing a personalized “travel impact footprint” (Figure 1). This provided users with web-based access to their travel time, travel cost, calories expended, and CO2 produced. The footprint also compared each user’s data with three peer groups: the SF Bay area, the US average, and fellow Berkeley students (Figure 2). We then evaluated the participants over two weeks to learn whether access to this information led to a measurable increase in environmental sensitivity and a corresponding reduction in driving.
We paid participants $20 to sign up, install the app, and take an entry and exit survey. Each subject streamed travel data during the first week of the experiment. We used the data to develop personalized profiles that became the baseline footprint for each person. In the second week, participants gained access to the QT website. Most said they enjoyed the site and appreciated the information provided. All 135 subjects kept the QT App active during the two week study and looked at their personal QT web profile an average of 4.1 times during the second week. Analysis of the before-and-after survey responses suggests that QT represents a promising tool to shift people toward more sustainable attitudes and travel behavior.
Our sample group consisted of UC Berkeley affiliates, most of whom were undergraduate students. Their responses to our pre-test survey suggested they
- had little knowledge of the impact of their individual travel habits,
- held mixed views on the environment,
- were open to using sustainable travel modes,
- valued the potential health benefits, and
- had friends and family who support sustainable modes.
Nevertheless, our subjects also acknowledged constraints on their ability to alter their travel modes, and most stated they had no intention of changing their travel behavior.
How then did the QT experiment affect their travel behavior? We explored whether receiving QT information affected travel patterns, and developed a model to identify statistically significant drivers of behavioral change. In the pre- and post-test surveys, we asked our subjects about a wide range of topics, including their
- awareness of the resources they expend in their travel,
- attitudes toward travel and its environmental and health impacts,
- beliefs regarding how their friends, family, and society view travel issues,
- belief in their ability to change their travel behavior, and
- interest in setting goals to change their travel behavior.

In the post-survey responses, we observed significant shifts across a range of behavioral categories suggesting that information from QT made their behavior more sustainable. The most significant shifts in responses were related to questions regarding the calories and CO2 they expended from their travel—unsurprising results since the data in these two categories were the primary focus of the QT feedback system. QT had less impact on social norms, goal setting, and perceived ability to change their travel behavior. There were, however, small-scale shifts in these categories. In the post-survey, respondents disagreed more with the statement, “many constraints and limitations keep me from changing my transportation behavior.” They also agreed more with the statement, “I can get exercise when traveling.” These responses suggest that QT can generate more sustainable travel habits.
Several responses to the questions targeting attitudes toward sustainable transport changed as well. For example, in post-survey responses, more people agreed with the policy to raise the price of gas to reduce congestion and pollution. People also shifted their feelings on sustainable behavior. After QT, more people felt it was important to engage in sustainable travel behavior and felt guilty for not using sustainable modes. Even though the individuals in our sample generally held “pro-health” views from the start, we observed an increase in the belief that sustainable transportation modes are beneficial to one’s health.
Responses to two questions, however, demonstrated shifts toward less sustainable beliefs. Subjects were less likely to agree with the statements:
- “Greenhouse gases cause environmental problems such as global warming.”
- “Everybody together should reduce the amount of fuel burned by their transportation behavior.”
The reasoning behind these responses is unclear. It could be a reaction to the clearly environmentalist orientation of the experiment. Another explanation could be that pre-survey responses were very positively pro-environment, offering little room for improvement.
We also saw positive shifts in respondents’ stated intentions to drive less and bike and walk more. Intentions and actions, however, are two different things. Smartphone tracking allowed us to measure actual travel mode shifts between the two weeks, and we observed a statistically significant decrease in the average distance driven—39 kilometers (24 miles) or 33 percent less driving than the first week (Figure 3). While we did not observe a statistically significant increase in non-vehicle kilometers traveled, we did observe shifts in walking and biking based on driving frequency. Frequent drivers—those who reported in the pre-survey that they drove two or more days per week—shifted to walking and biking more than infrequent drivers. Frequent drivers drove on average 120 fewer kilometers (75 fewer miles) during the second week of the experiment than they drove during the first week, representing a reduction of 38 percent. Infrequent drivers drove 20 fewer kilometers (12 fewer miles) during the second week, for a reduction of 27 percent. Neither group significantly changed their distance traveled by transit, although frequent drivers walked on average 5 km more during the second week, for an increase of 42 percent over the first week.
We developed a behavioral model to assess whether the reductions in driving related to psychological changes measured by the entry and exit surveys. The model showed heightened awareness of CO2 and calories expended when travelers changed attitudes and norms. The QT design of comparing one’s own resource expenditures with those of one’s peers seemed to play a significant role in changing attitudes toward more sustainable travel. We found that a positive change in attitude toward environmentally friendly transportation was strongly associated with less driving in the second survey week. In addition, those who more frequently signed in to the QT website significantly increased their walking and biking distances.
A Different ITS
Intelligent Transportation Systems (ITS), like QT, integrate information technology with transportation. While much of ITS aims to make better use of the existing transportation infrastructure, QT represents an emerging effort to develop information services designed to encourage behavioral changes. Real-time traffic information can impact route and departure time choice, but these services have little impact on mode choice. Mode choice is rooted in lifestyle choices that are psychologically complex and harder to change. Several programs effectively use information to influence mode and trip choice, such as the Travel Feedback Programs in Japan, Personalized Travel Planning in England, and Travel Blending in Australia. Such programs, however, often rely on person-to-person dialog and intervention instead of a Google Map-style automated information system. QT’s automated style targets mode and trip decision-making by showing real-time results of travelers’ actions and how those results compare to their peers’ behavior. This form of ITS mimics certain psychological approaches to behavior change used by counselors and society in general.
Can automated travel feedback replace the human-to-human component used in other travel counseling programs? Travel feedback programs with in-person counselors have a record of success. If a computational surrogate could behave similarly to a counselor, travel feedback programs could be deployed at larger scales. We know people persuade people. Can computational systems persuade people? Our QT evaluation suggests they can.
This article is adapted from “Quantified Traveler: Travel Feedback Meets the Cloud to Change Behavior,” originally published in the Journal of Intelligent Transportation Systems: Technology, Planning, and Operations. Note: the Quantified Traveler website is no longer active.

